Assignment #4
1. Discuss the eight principles of the ISO 9000 standard
ISO stands for International Organization for Standardization and they count with various published international standards in different industries and areas. ISO 9000 is the one stated for quality management. As part of their publishing, they stated 8 ground rules or principles to follow:
-
Customer focus: Organizations can establish this focus by trying to understand and meet their customers’ current and future requirements and expectations.
-
Leadership: Organizations succeed when leaders establish and maintain the internal environment in which employees can become fully involved in achieving the organization’s unified objectives.
-
Involvement of people: Organizations succeed by retaining competent employees, encouraging continuous enhancement of their knowledge and skills, and empowering them, encouraging engagement and recognizing achievements.
-
Process approach: Organizations enhance their performance when leaders manage and control their processes, as well as the inputs and outputs that tie these processes together.
-
System approach to management: Organizations sustain success when processes are managed as one coherent quality management system.
-
Continuous improvement: Organizations will maintain current levels of performance, respond to changing conditions, and identify, create and exploit new opportunities when they establish and sustain an ongoing focus on improvement.
-
Factual approach to decision making: Organizations succeed when they have established an evidence-based decision making process that entails gathering input from multiple sources, identifying facts, objectively analyzing data, examining cause/effect, and considering potential consequences.
-
Mutually beneficial supplier relationships: Organizations that carefully manage their relationships with suppliers and partners can nurture positive and productive involvement, support and feedback from those entities.
2. Discuss Pareto Chart
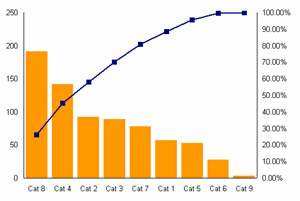
Pareto is a type of chat that visually demonstrated levels in both bars and line graphs. Based on what you want to show, the bars are placed in descending order while the line graph represents the accumulated value of the bars. This is a great tool to clearly detect problems and catalog them in order of importance, this way the person analyzing it can easily decide where to put his efforts and improve quality. In other words, Pareto Charts can help us prioritize in order to make the most results with the less resources possible.
3. Discuss fishbone diagrams
The fish bone diagram is another great tool to help and analyze more efficiently what causes a problem. With the Pareto you can identify the problem, but with this diagram you can take the problem found and find what triggers them. Is a very detailed way to identify the problem causers. It is known as a fishbone diagram because of its fiscal look; it looks like a skeleton of a fish. It is also known as the cause and effect diagram. This tool is not just a great problem solver, but also to a tool used to optimize processes and maintain a continuous improvement environment. As we can see on the fishbone diagram above, the middle horizontal line represents the effect caused by the problem, which in this case is being late for work. The vertical lines represent the inputs that are causing the problem.
4. Discuss histograms
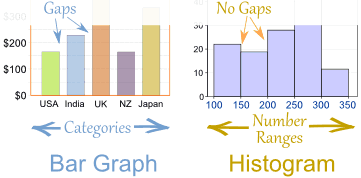
A histogram is a type of chart commonly used to monitor occurrences in a process. Basically the occurrences are shown in bars, which represents the numerical data. This method was first introduced by Karl Pearson, a mathematician and biostatistician. This chart looks a lot like the pareto chart or other bar graphs, the difference (fiscally) is that in histograms, the bars are together one from the other. For this reason, histograms are a perfect tool to use when dealing with continuous data.
5. Discuss control charts for variables
A control chart is commonly used to maintain and control quality in a certain process. A control chart is basically a run chart but with controls on both upper level and lower level. This controls are known as UCL (Upper Control Limit) and LCL (Lower Control Limit). As shown on the example above, the line of occurrence must be in between the two control limits in order to have the necessary quality. The purpose of this chart is to easily monitor and detect if the measured thing is being under control or if it need to get improved and arranged.
6. Discuss flowcharts and give a simple example
A flowchart is a diagram which visually shows the step by step of a process. The representation consists of placing each workflow or process inside a box and connect all of them with arrows pointing to the next step. After the flowchart is done completely, the team members or groups involved can determine how to improve the process by analyzing the chart and identifying the bigger problem coursers.
7. Explain what is an FMEA
FEMA, the acronym that stands for Failure Mode and Effects Analysis. This is a method used to identify how and where are failures happening in a process or product. Groups or teams use FEMA to look for possible failures and also prevent them from happening by correcting the process. The purpose is to identify what processes have the biggest or worst flaws in order to change them. FEMA looks into the steps in the process and look for what could go wrong, this part is known as the failure modes. Then, it moves to look for causes and ask itself why would the failure happen. Finally, it analyzes the consequences that may happen with those failures.
8. Provide an overview of the Toyota practical problem solving process